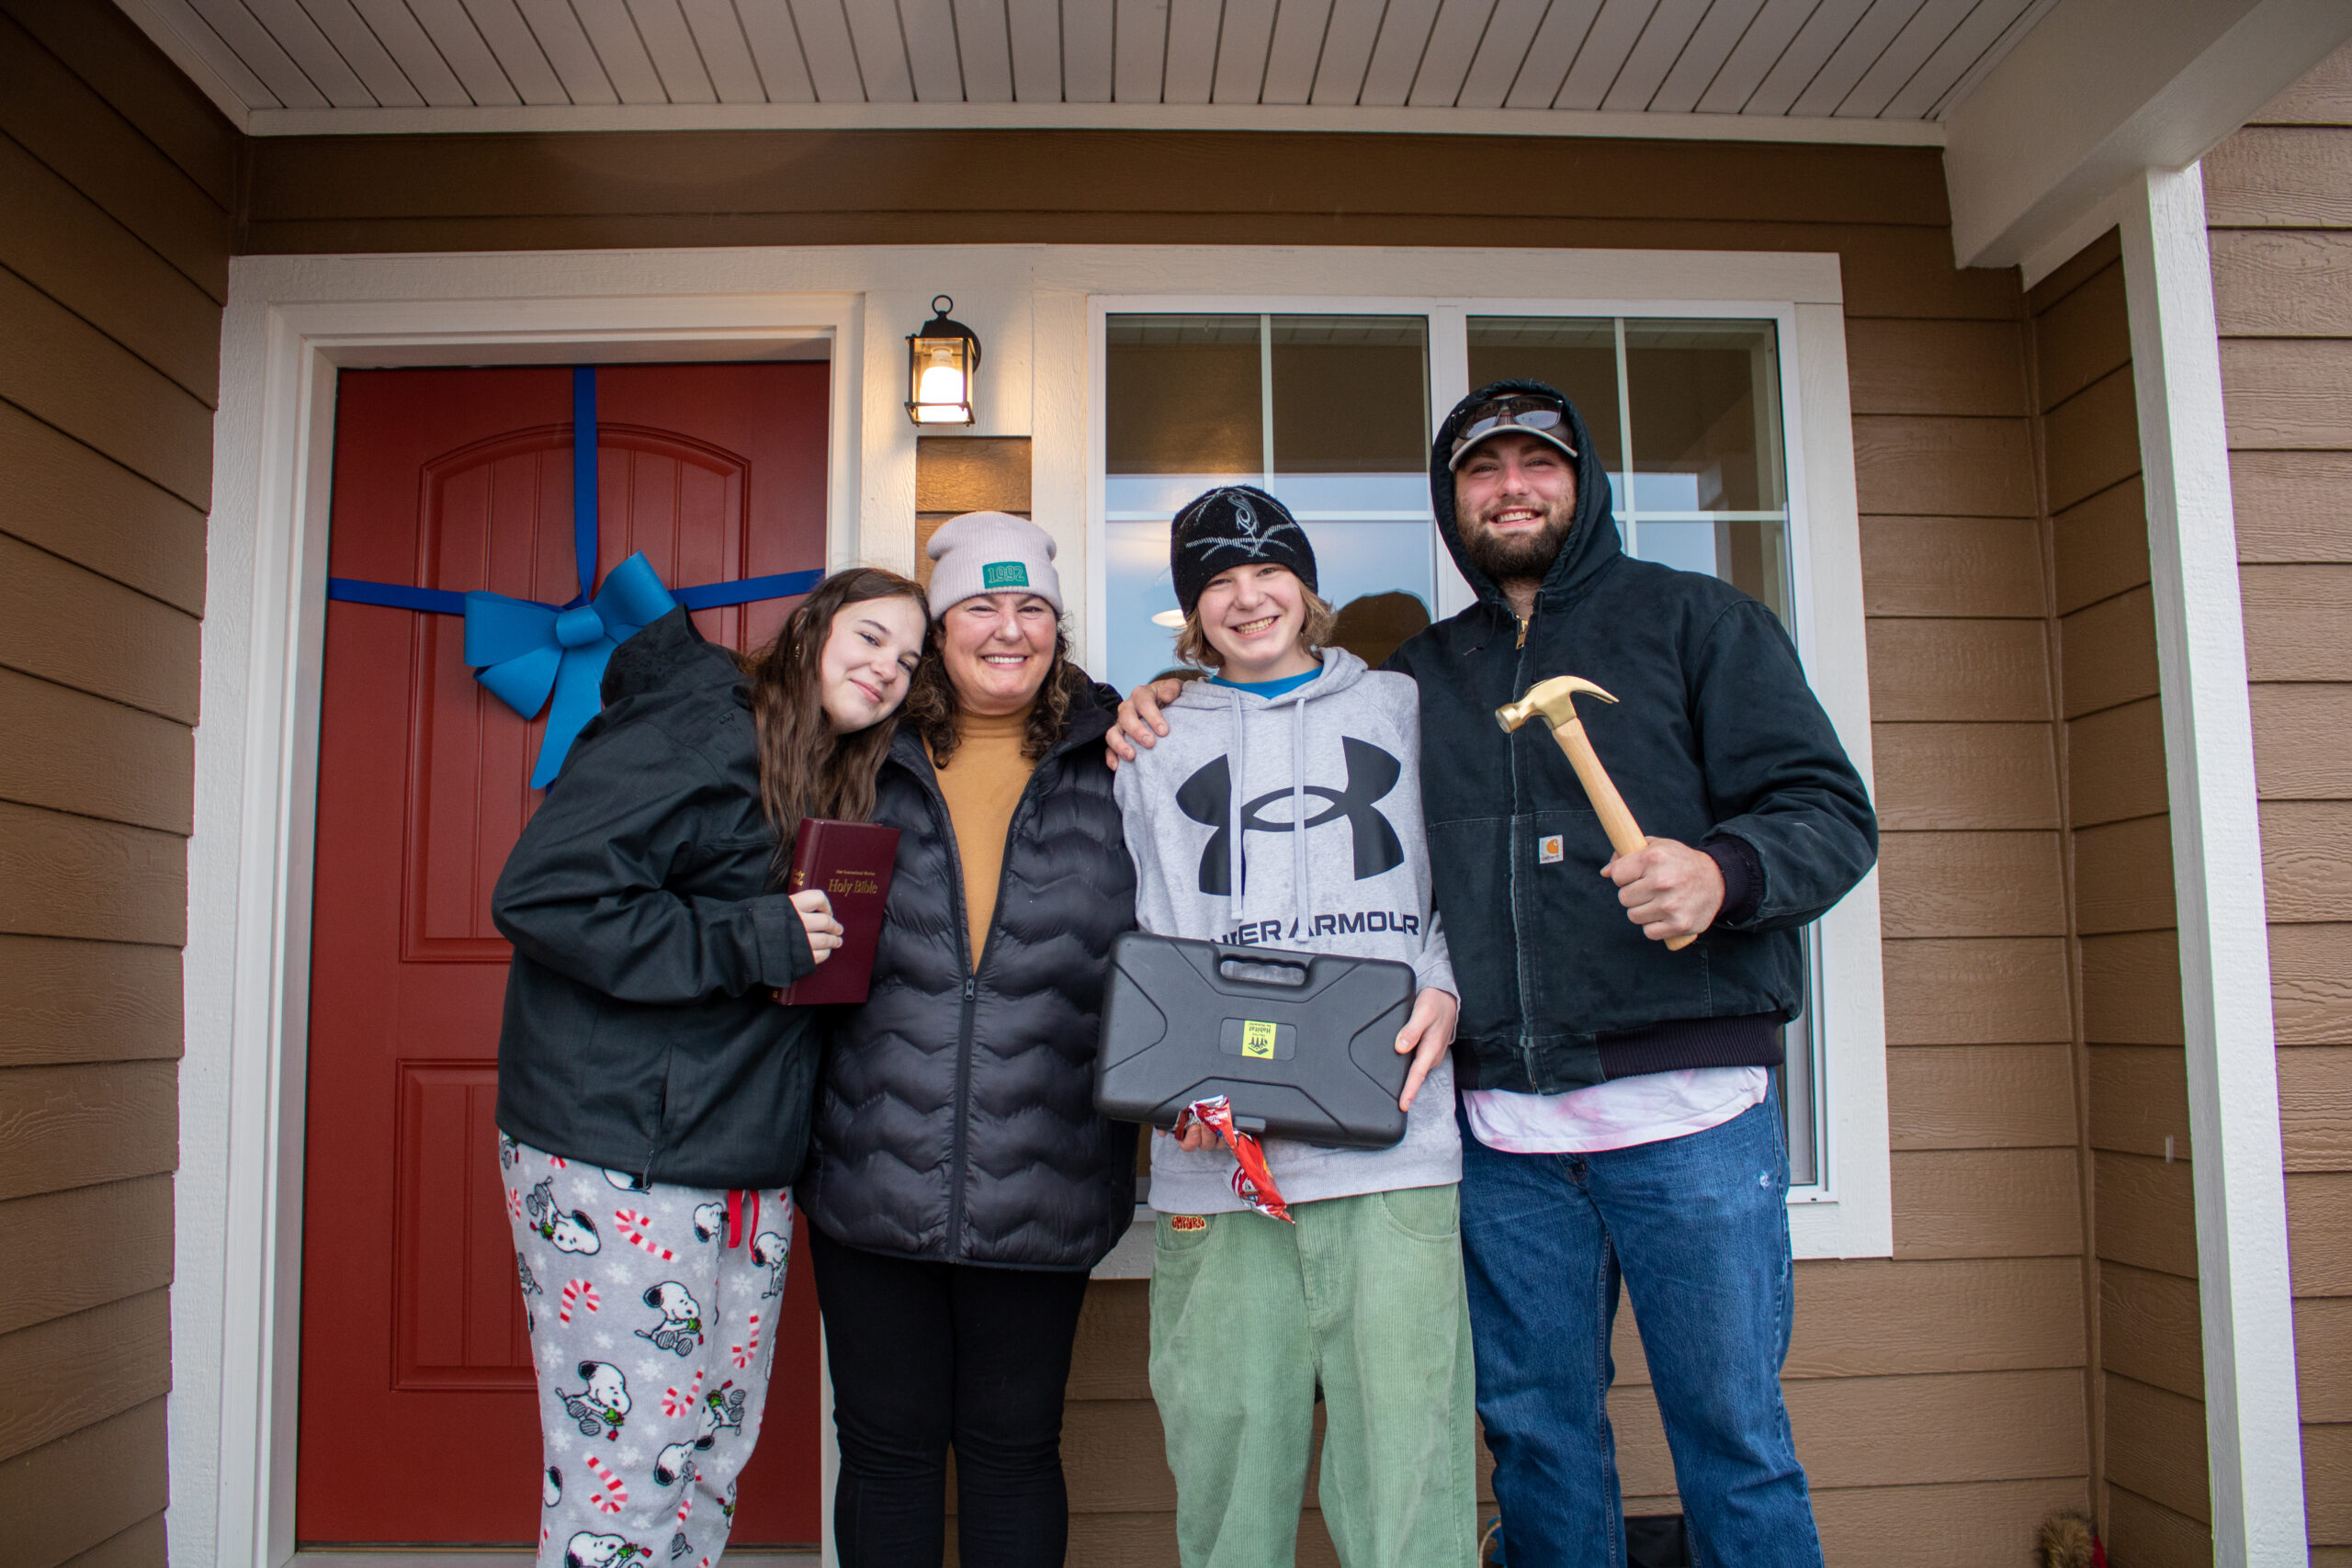

Outcomes for Pikes Peak Habitat Homeowners
Ashley Peacock, a Master of Public Administration student in the College of Public Service, University of Colorado at Colorado Springs, researched outcomes for Pikes Peak Habitat for Humanity homeowners as her capstone project in spring 2024.
She surveyed homeowners for six key factors:
- Educational outcomes
- Neighborhood and home stability
- Financial stability and wealth-building
- Employment opportunities
- Health outcomes
- Civic and social engagement
93% of homeowners surveyed said their lives had become better overall since they purchased their Pikes Peak Habitat homes.
77% said they would not have been able to own a home without Pikes Peak Habitat.
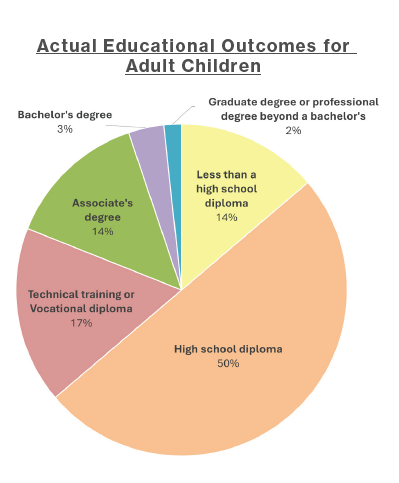
Educational Outcomes

85% felt better about their ability to support post-secondary education for their children
77% felt better about their children’s future
77% felt better about their children’s overall confidence
58% reported that their children’s attendance had improved
58% felt satisfied with the quality of schools in their neighborhood
54% felt that their children’s grades had improved
51% felt that their Habitat home provided better educational opportunities
47% reported pursuing additional education after becoming a homeowner
36% were able to provide financial support for their children who pursued post-secondary educations (8 of 22)
Neighborhood & Home Stability
88% felt more stable in their living situation
78% felt more pride in their neighborhood
73% felt safer in their current home than where they were before
66% felt their home provided a cleaner and healthier environment
63% rated their home as a place to live as 8+ (on a scale of 1-10)
59% reported not worrying about their long-term ability to stay in their homes
56% felt safer in their current neighborhood than where they were before
56% felt their current homes were more affordable to repair
49% rated their neighborhood as a place to live as 8+ (on a scale of 1-10)
46% felt their current homes were easier to repair
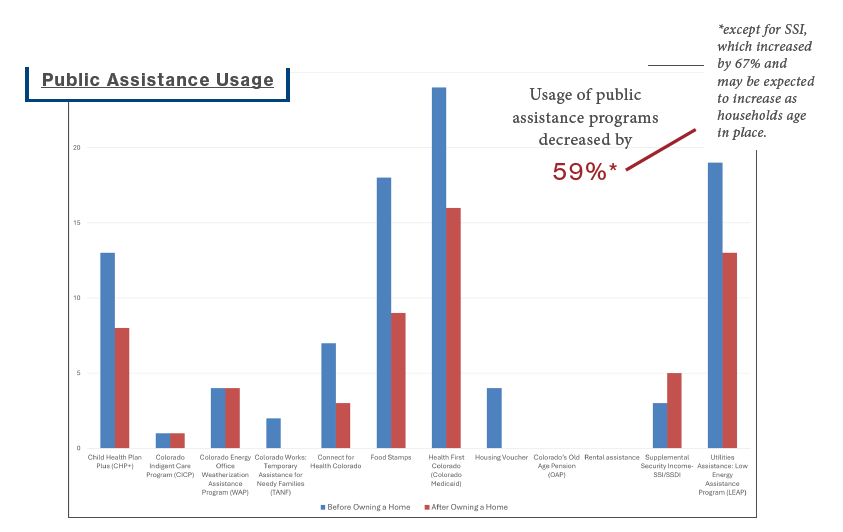
Financial Stability and Wealth-Building
90% said it was important to save money
82% reported better financial security since becoming a homeowner
77% agreed that their ability to build credit had improved
72% agreed their ability to pay bills had improved
69% agreed their ability to save money had improved
67% felt financially better than 5 years ago
67% agreed that their ability to manage debt had improved
63% agreed that their ability to stick to a budget had improved
59% had little difficulty paying bills on time
59% felt more able to cover unexpected expenses than before they owned a home
54% reported they worry about covering unexpected expenses
41% agreed they were able to build wealth through homeownership
Employment Opportunities
68% worked full-time
58% felt better about their job prospects
56% felt better about their ability to commute to work
53% felt better about their ability to progress in their career
47% felt better about their job security
46% worked in healthcare
17% worked in education, training, or library
Health Outcomes

71% agreed they had better access to outdoor space
64% felt less stressed
61% felt their mental health had improved
59% felt they could age in place in their homes
55% felt their physical health had improved
46% agreed they could afford to buy food
41% agreed they could afford their prescriptions
32% agreed they could more easily afford healthcare
Civic and Social Outcomes
66% felt they spent more time as a family
61% volunteered more in the community
56% felt they spent more time with friends and extended family
54% engaged more with religious organizations
51% felt they participated about the same in community events
46% engaged more with neighborhood or community groups
41% felt they voted more in local, state, or federal elections